Korean Insurance Market
1. Insurance Regulatory Changes in 2025
Increase in Coverage Limits for Gas Accident Liability Insurance
Gas accident liability insurance is a mandatory insurance policy designed to compensate for damage to a third party's life, body, or property caused by a gas accident. To ensure that victims receive adequate compensation in the event of death or injury resulting from a gas-related incident, the coverage limits have been increased.
Gas Accident Liability Insurance
| Category | Current | Revised |
|---|
| Death & Permanent Disability | Up to KRW 80 million | Up to KRW 150 million |
|---|
| Injury | Up to KRW 15 million | Up to KRW 30 million |
|---|
Increase in Coverage Limits for Children's Playground Liability Insurance
Children's playground liability insurance is a mandatory policy designed to compensate for damage to a third party's life, body, or property resulting from the use of playground equipment at designated facilities. Four additional facility types - science museums, arboretums and gardens, public sewage treatment facilities, and amusement parks - have also been added to the list of facilities subject to mandatory insurance requirements.
Children’s Playground Liability Insurance
| Category | Current | Revised |
|---|
| Death & Permanent Disability | Up to KRW 80 million | Up to KRW 150 million |
|---|
| Injury | Up to KRW 15 million | Up to KRW 20 million |
|---|
| Property Damage | KRW 2 million | KRW 2.5 million |
|---|
Group Insurance Beneficiary Change for Non-Work-Related Accidental Death
In group insurance policies, the beneficiary for non-work-related death has been changed from the company to the employee's legal heirs to better protect workers' interests.
Beneficiary Change
| Category | Current | Revised |
|---|
| Beneficiary of Group Insurance Non-Work-Related Accidental Death | Policyholder or Legal Heirs | Legal Heirs |
|---|
Expansion of the Anti-Insurance Fraud System
With the amendment and enforcement of the Special Act on the Prevention of Insurance Fraud, penalties now extend beyond the act of insurance fraud to include brokerage, inducement, solicitation, and advertising of fraudulent activities related to insurance. Revised reporting-reward guidelines took effect on January 1, 2025, introducing a KRW 1 million reward for reporting such activities.
Korean Insurance Market
2. Preliminary Business Results of Insurers in Korea for Q1-Q3 2024
From January to September 2024, gross written premiums of all insurers in Korea (22 life insurers and 31 non-life insurers) amounted to KRW 170.09 trillion, an increase of KRW 7.78 trillion (+4.8%) compared to the same period of the previous year.
Premium Income (Unit: KRW billion)
| Category | Jan-Sep 2023 | Jan-Sep 2024 | Change (%) |
|---|
| Life Insurers | 76,458.9 | 80,831.3 | 5.7 |
|---|
| - Protection | 36,029.6 | 40,717.0 | 13.0 |
|---|
| - Savings | 21,544.9 | 22,535.7 | 4.6 |
|---|
| - Variable | 9,313.7 | 9,270.2 | -0.5 |
|---|
| - Retirement Annuity, etc. | 9,570.7 | 8,308.4 | -13.2 |
|---|
| Non-Life Insurers | 85,853.6 | 89,263.6 | 4.0 |
|---|
| - Long-term | 49,356.6 | 51,918.4 | 5.2 |
|---|
| - Motor | 15,831.8 | 15,606.5 | -1.4 |
|---|
| - General P&C | 10,460.5 | 11,308.5 | 8.1 |
|---|
| - Retirement Annuity, etc. | 10,204.7 | 10,430.2 | 2.2 |
|---|
| Total | 162,312.5 | 170,094.9 | 4.8 |
|---|
For the first three quarters of 2024, the net income of all insurers amounted to KRW 13.40 trillion, an increase of KRW 1.56 trillion (+13.2%) compared to the same period of the previous year. Life insurers recorded KRW 5.31 trillion and non-life insurers KRW 8.09 trillion.
Net Income (Unit: KRW billion)
| Category | Jan-Sep 2023 | Jan-Sep 2024 | Change |
|---|
| Life Insurers | 4,714.4 | 5,310.0 | +12.6% |
|---|
| Non-Life Insurers | 7,123.2 | 8,090.0 | +13.6% |
|---|
| Total | 11,837.6 | 13,400.0 | +13.2% |
|---|
ROA and ROE (Unit: %)
| Metric | Category | Jan-Sep 2023 | Jan-Sep 2024 | Change (%p) |
|---|
| ROA - Life | Life Insurers | 0.75 | 0.79 | 0.04 |
|---|
| ROA - Non-Life | Non-Life Insurers | 2.95 | 3.07 | 0.12 |
|---|
| ROA - Total | Total | 1.37 | 1.44 | 0.07 |
|---|
| ROE - Life | Life Insurers | 5.80 | 7.43 | 1.63 |
|---|
| ROE - Non-Life | Non-Life Insurers | 15.36 | 17.33 | 1.97 |
|---|
| ROE - Total | Total | 9.27 | 11.35 | 2.08 |
|---|
Total Assets and Shareholders’ Equity (Unit: KRW trillion)
| Metric / Category | Dec 2023 | Sep 2024 | Change (%) |
|---|
| Total Assets - Life | 882.6 | 898.6 | 1.8 |
|---|
| Total Assets - Non-Life | 343.7 | 358.4 | 4.3 |
|---|
| Total Assets - Total | 1,226.3 | 1,257.0 | 2.5 |
|---|
| Total Liabilities - Life | 777.6 | 813.2 | 4.6 |
|---|
| Total Liabilities - Non-Life | 280.5 | 297.1 | 5.9 |
|---|
| Total Liabilities - Total | 1,058.1 | 1,110.3 | 4.9 |
|---|
| Shareholders’ Equity - Life | 105.0 | 85.4 | -18.7 |
|---|
| Shareholders’ Equity - Non-Life | 63.2 | 61.3 | -3.0 |
|---|
| Shareholders’ Equity - Total | 168.2 | 146.7 | -12.8 |
|---|
In summary, insurers’ net income increased year on year, driven by improvements in both underwriting and investment profitability. However, total liabilities increased due to declining interest rates and regulatory changes resulting in a lower discount rate for insurance liabilities, which in turn led to a decline in shareholders' equity.
Korean Insurance Market
3. K-ICS Ratios of the Korean Insurance Industry as of September 2024
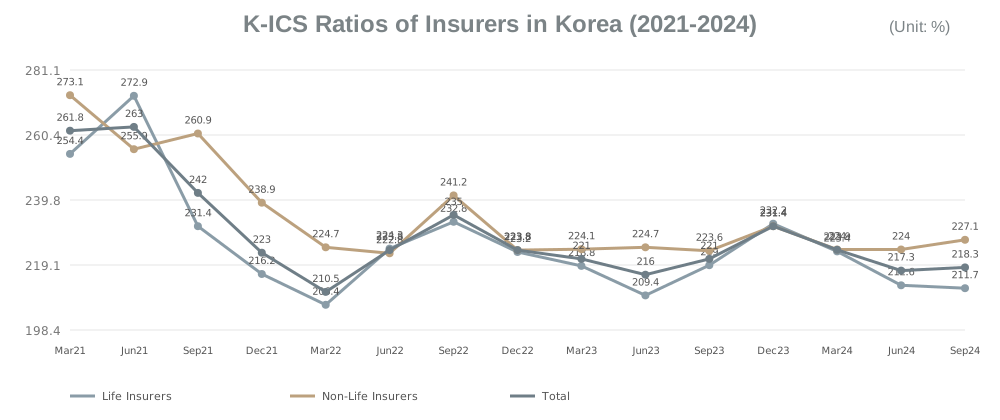
As of the end of September 2024, the Korean Insurance Capital Standard (K-ICS) ratio of all insurers, after applying transitional measures, stood at 218.3%, increasing by 1.0%p from the previous quarter (217.3%). Life insurers recorded 211.7%, while non-life insurers reported 227.1%.
The primary factors behind the change in the K-ICS ratio were a decline in available capital due to falling stock prices and lower market interest rates, alongside a decrease in required capital driven by the impact of declining stock prices.
K-ICS Ratios and Impacts from Transitional Measures (as of September 2024)
| Category | Q2 2024 Before | Q3 2024 Before | Change | Q2 2024 After | Q3 2024 After | Change |
|---|
| Available Capital (KRW trillion) | 257.5 | 256.0 | -1.5 | 260.4 | 258.9 | -1.5 |
|---|
| Required Capital (KRW trillion) | 127.8 | 126.3 | -1.5 | 119.8 | 118.6 | -1.2 |
|---|
| K-ICS Ratio (%) | 201.5 | 202.7 | +1.2 | 217.3 | 218.3 | +1.0 |
|---|
The K-ICS ratio of insurers remained at a stable level of 218.3%, demonstrating robust solvency of the Korean insurance industry. The FSS continues to monitor ratios and identify signs of deterioration at an early stage.
Korean Insurance Market
4. Utilization of Retirement Pension Reserves for Purchasing Protection-Type Insurance Products
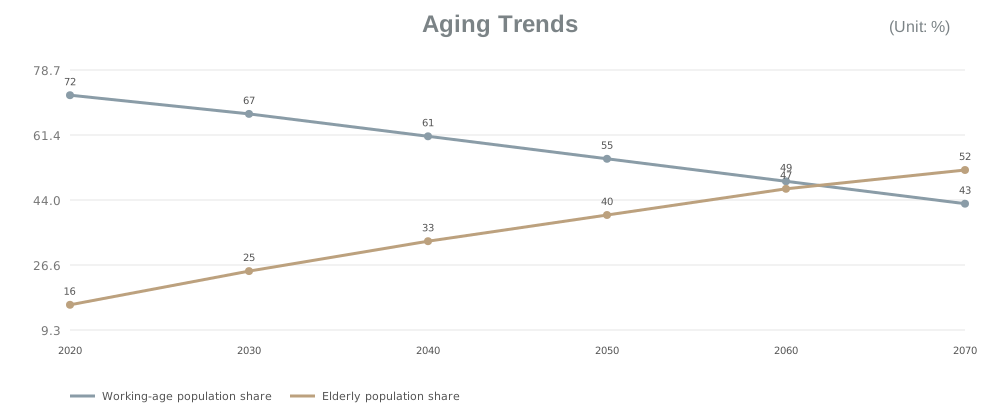
Rapid population aging and increased life expectancy are expected to heighten longevity risk at both the societal and individual levels. As of July 2024, Korea's population aged 65 and older exceeded 10 million, with an aging rate of 19.2%. By 2025, the proportion of elderly individuals is projected to surpass 20%, marking Korea's entry into a super-aged society.
The National Pension System is increasingly viewed as a key measure to address longevity risk. At the same time, retirement pension reserves exceeded KRW 400 trillion in the first half of 2024 and are expected to become an increasingly important retirement asset pool.
Changes in Allocation Limits for In-House Principal-Protected Products and Inclusion of Protection-Type Insurance
| Period | Dec 1, 2005~ | Dec 1, 2011~ | Apr 1, 2013~ | Jan 1, 2015~ | July 1, 2015 |
|---|
| Maximum Allocation Ratio | 100% | 70% | 50% | 30% | Prohibited |
|---|
| Inclusion of Protection-Type Insurance | Allowed | Allowed | Not Allowed | Not Allowed | Not Allowed |
|---|
Protection-Type Insurance in Retirement Pensions by Country
| Category | United States | Japan | Australia |
|---|
| Inclusion | Allowed | Allowed | Allowed with restrictions |
|---|
| System | DB plans / Health Savings Account (401(h)) | DC plans / General insurance | DC plans / MySuper scheme |
|---|
| Coverage | Medical expenses, protection-type insurance | Death due to accident | Death, TPD, income protection |
|---|
Gradually incorporating protection-type insurance into retirement pension management would allow retirement pensions to function as a comprehensive financial asset, supporting not only post-retirement living but also disability coverage, survivor benefits, and medical expense protection.
Korean Insurance Market
5. Insurance Company CEO Survey
The Insurance Company CEO Survey, conducted by the Korea Insurance Research Institute (KIRI), was first introduced in 2020. The 2024 survey marks its fifth year, with 34 out of 44 insurance company CEOs participating: 18 from life insurers and 16 from non-life insurers.
1) Economic Outlook
More than half of CEOs expected Korea's economy in 2025 to be slightly worse than in 2024. Key risks delaying economic recovery were identified as political uncertainty in major economies and rising household debt. Overall, 94.1% of respondents expected long-term interest rates to decline.
2) Management Indicator Forecast
While 82.4% of respondents expected net income to increase in 2024, 88.2% expected an increase in 2025. Regarding capital adequacy, 79% of insurance companies plan to maintain their K-ICS ratio within the 151-250% range in 2025.
3) Insurance Industry Assessment
Consumer trust in the insurance industry was generally perceived as moderate or low. Key factors included insurance product sales practices, claims payment practices, consumer understanding of insurance, complaint handling practices, and insurance fraud.
4) Management Strategy Formulation
CEOs prioritized enhancing distribution channel competitiveness and developing new products. Life insurers will focus on health and whole-life insurance, while non-life insurers will continue to emphasize long-term personal insurance and general non-life products.
5) Summary
Competition in the health insurance market between life and non-life insurers is expected to remain intense in 2025, while the need for long-term business model transformation continues to grow.
Korean Insurance Market
6. Analysis of Engineering Insurance Losses over the Past 10 Years
1) Analysis of Incurred Losses
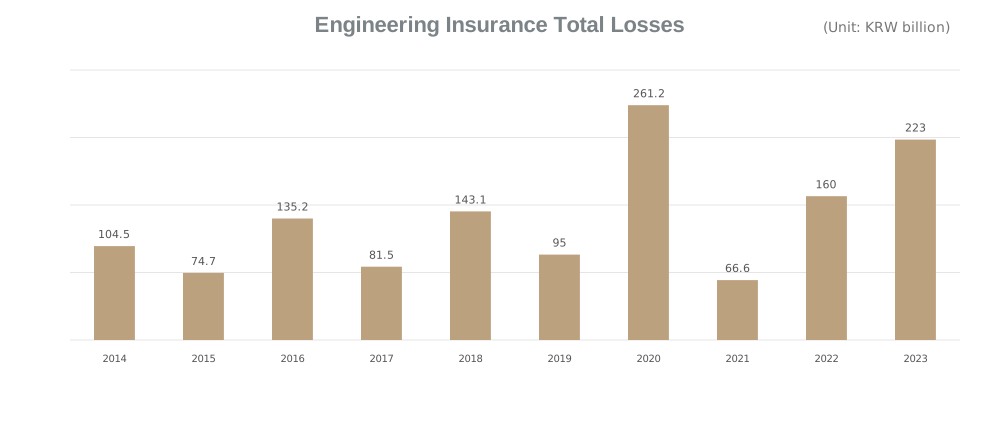
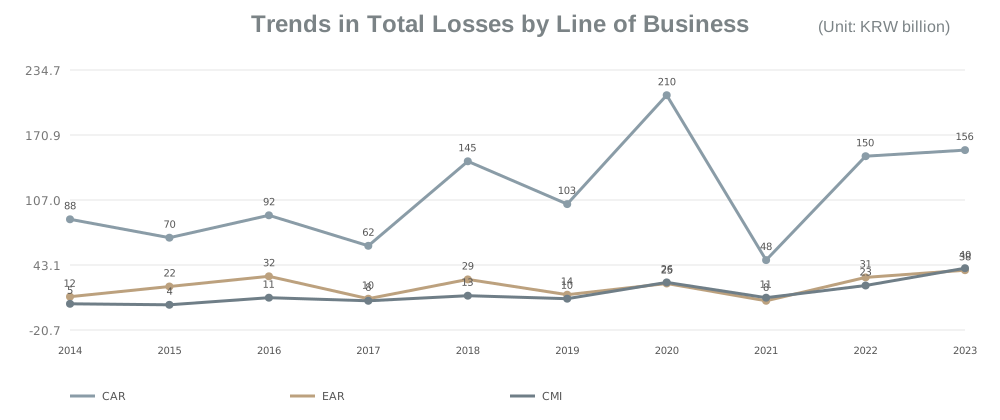
Over the past 10 years (2014-2023), the average number of accidents for engineering insurance (CAR, EAR, CMI) was 1,116 per year, showing a gradual increase over time. The highest number of accidents was recorded in 2023, with 1,516 cases. The average annual total loss amount over the same period was KRW 134.5 billion, with the highest loss recorded in 2020 at KRW 261.2 billion.
Trends of Large Insured Losses Exceeding KRW 2 Billion (Unit: KRW billion)
| Category | 10-Year Average | Recent 4-Year Average |
|---|
| Total - No. of Accidents | 11.0 | 13.0 |
|---|
| Total - Total Losses | 64.7 | 85.1 |
|---|
| Total - Proportion of Total Losses | 48.1% | 52.1% |
|---|
| CAR - No. of Accidents | 6.6 | 7.3 |
|---|
| CAR - Total Losses | 38.5 | 52.3 |
|---|
| EAR - No. of Accidents | 3.0 | 3.5 |
|---|
| EAR - Total Losses | 18.6 | 17.0 |
|---|
| CMI - No. of Accidents | 1.4 | 2.5 |
|---|
| CMI - Total Losses | 7.5 | 15.8 |
|---|
2) Case Analysis of Accidents
By industry sector, CAR losses were most frequently reported in general construction (42.7%), followed by road projects (21.7%), railway construction (15.2%), and river projects (13.2%). In EAR, the highest proportion of losses occurred in the power industry (67.0%), followed by metal machinery and equipment manufacturing (14.0%) and the petrochemical industry (6.5%).
CAR - Analysis by Industry
General Construction 42.7%; Roads 21.7%; Railways 15.2%; Rivers & Waterways 13.2%; Other 7.2%
EAR - Analysis by Industry
Power Industry 67%; Metal Machinery 14%; Petrochemical 6.5%; Other 12.5%
CAR - Analysis by Accident Type
Natural Disasters 32.2%; Physical Damage 22.8%; Insured's Negligence 15.3%; Other 29.7%
EAR - Analysis by Accident Type
Physical Damage 39%; Natural Disasters 17.5%; Fire 11.5%; Other 32%
3) Power Plant Accident Analysis
Over the past 10 years, the average number of power plant accidents per year was 12 cases, with an annual average total loss of KRW 19.8 billion.
Number of Accidents and Total Losses by Power Plant Type (Unit: KRW billion)
| Power Plant Type | Average No. of Accidents | Average Total Losses |
|---|
| Nuclear Power | 3.9 | 3.3 |
|---|
| Combined Cycle Power | 1.0 | 1.8 |
|---|
| Thermal Power | 5.3 | 13.2 |
|---|
| Other | 1.8 | 1.5 |
|---|
| Total | 12.0 | 19.8 |
|---|
4) Natural Disaster Accident Analysis
For natural disaster accidents exceeding KRW 100 million, CAR showed average losses of KRW 26.2 billion, while EAR averaged KRW 5.1 billion. Typhoons and heavy rain accounted for the majority of losses.
Breakdown of Losses by Peril Over the Past 10 Years (Unit: KRW billion)
| Line / Peril | 10-Year Average | Ratio |
|---|
| CAR - Typhoon | 16.1 | 61.4% |
|---|
| CAR - Heavy Rain | 8.5 | 32.5% |
|---|
| CAR - Cold Damage | 0.0 | 0.1% |
|---|
| CAR - Others | 1.6 | 6.1% |
|---|
| EAR - Typhoon | 1.7 | 33.8% |
|---|
| EAR - Heavy Rain | 2.6 | 50.1% |
|---|
| EAR - Others | 0.8 | 16.1% |
|---|
5) Seasonal Factors
The proportion of natural disaster losses relative to total losses is 32.6% for CAR and 18.9% for EAR. Both CAR and EAR experience the majority of natural-disaster-related losses during the summer months.
Monthly Total Losses over the Past 10 Years (KRW 100 Million and Above) (Unit: KRW billion)
| Line | Jan | Feb | Mar | Apr | May | Jun | Jul | Aug | Sep | Oct | Nov | Dec | Total |
|---|
| CAR Total Losses | 54.9 | 23.9 | 170.1 | 43.9 | 44.9 | 38.6 | 88.1 | 78.0 | 102.2 | 81.0 | 36.0 | 35.5 | 802.8 |
|---|
| CAR Natural Disaster Ratio | 3.1% | 1.7% | 0.6% | 2.6% | 10.6% | 7.2% | 65.9% | 61.4% | 78.0% | 71.4% | 3.1% | 14.9% | 32.6% |
|---|
| EAR Total Losses | 13.6 | 7.0 | 2.8 | 28.4 | 51.9 | 24.8 | 18.8 | 40.4 | 21.9 | 18.1 | 24.7 | 22.5 | 275.0 |
|---|
[1] Gas accidents include incidents caused by high-pressure gas, LPG, urban gas, and hydrogen.