Korean Insurance Market
Preliminary Business Results of Insurers in Korea for Q1 2025
In the first quarter of 2025, total premium income for all insurers in Korea, comprising 22 life insurers and 31 non-life insurers, amounted to KRW 62.73 trillion, up KRW 4.06 trillion (+6.9%) from the same period a year earlier.
In the life insurance sector, premium income amounted to KRW 31.11 trillion, up KRW 3.07 trillion (+11.0%). This reflected increases in protection-type insurance (+12.5%), variable insurance (+8.8%), and retirement annuities (+69.7%), which offset the decline in savings-type insurance (-13.4%).
In the non-life insurance sector, premium income amounted to KRW 31.62 trillion, up KRW 0.99 trillion (+3.2%). Premiums increased in long-term insurance (+6.6%) and general P&C (+4.4%), while motor insurance (-2.9%) and retirement annuities (-3.3%) declined.
< Premium Income >(Unit: KRW billion)
| Classification | 2024.1Q | 2025.1Q | Change (%) |
|---|
| Life Insurers | 28,039.3 | 31,112.1 | 11.0 |
|---|
| - Protection | 13,248.9 | 14,903.8 | 12.5 |
|---|
| - Savings | 8,442.6 | 7,310.3 | -13.4 |
|---|
| - Variable | 3,079.3 | 3,350.7 | 8.8 |
|---|
| - Retirement Annuity, etc. | 3,268.5 | 5,547.3 | 69.7 |
|---|
| Non-Life Insurers* | 30,630.0 | 31,619.0 | 3.2 |
|---|
| - Long-term | 16,788.4 | 17,903.7 | 6.6 |
|---|
| - Motor | 5,263.1 | 5,109.7 | -2.9 |
|---|
| - General P&C | 3,997.0 | 4,174.8 | 4.4 |
|---|
| - Retirement Annuity, etc. | 4,581.5 | 4,430.8 | -3.3 |
|---|
| Total | 58,669.3 | 62,731.1 | 6.9 |
|---|
* Based on direct premiums
(Source: Financial Supervisory Service, May 27, 2025)
In the first quarter of 2025, the total net income of all insurers in Korea amounted to KRW 4.10 trillion, a decrease of KRW 0.77 trillion (-15.8%) compared to the same period a year earlier. Life insurers recorded net income of KRW 1.70 trillion (-10.9%) year-on-year, as both underwriting and investment results deteriorated. Non-life insurers posted net income of KRW 2.40 trillion, down 19.0% year-on-year.
< Net Income >(Unit: KRW billion)
| Classification | 2024.1Q | 2025.1Q | Change (%) |
|---|
| Life Insurers | 1,903.9 | 1,695.6 | -10.9 |
|---|
| - Premium income or expenses | 1,280.2 | 1,157.2 | -9.6 |
|---|
| - Investment income or expenses | 1,172.9 | 1,013.0 | -13.6 |
|---|
| - Other income or expenses | -59.2 | -66.4 | - |
|---|
| Non-Life Insurers | 2,962.7 | 2,401.1 | -19.0 |
|---|
| - Premium income or expenses | 3,036.1 | 1,949.8 | -35.8 |
|---|
| - Investment income or expenses | 909.0 | 1,327.3 | 46.0 |
|---|
| - Other income or expenses | -14.3 | -17.9 | - |
|---|
| Total | 4,866.6 | 4,096.7 | -15.8 |
|---|
(Source: Financial Supervisory Service, May 27, 2025)
In the first quarter of 2025, the return on assets (ROA) of all insurers in Korea stood at 1.27%, down 0.32%p from the same period a year earlier, while the return on equity (ROE) was 11.94%, up 0.06%p year-on-year.
< ROA and ROE >(Unit: %)
| Classification | 2024.1Q | 2025.1Q | Change (%p) |
|---|
| ROA | Life Insurers | 0.86 | 0.74 | -0.12 |
|---|
| Non-Life Insurers | 3.45 | 2.59 | -0.86 |
|---|
| Total | 1.59 | 1.27 | -0.32 |
|---|
| ROE | Life Insurers | 7.47 | 8.58 | 1.11 |
|---|
| Non-Life Insurers | 19.13 | 16.49 | -2.64 |
|---|
| Total | 11.88 | 11.94 | 0.06 |
|---|
(Source: Financial Supervisory Service, May 27, 2025)
At the end of March 2025, total assets and total liabilities of insurers in Korea were KRW 1,300.6 trillion and KRW 1,168.1 trillion, respectively, up 2.5% and 3.7% from the end of 2024. Shareholders’ equity was KRW 132.5 trillion, down 6.9%.
< Total Assets and Shareholders’ Equity >(Unit: KRW trillion)
| As of Period End | Dec 2024 | March 2025 | Change (%) |
|---|
| Total Assets | Life Insurers | 905.5 | 926.4 | 2.3 |
|---|
| Non-Life Insurers | 363.5 | 374.1 | 2.9 |
|---|
| Total | 1,269.0 | 1,300.6 | 2.5 |
|---|
| Total Liabilities | Life Insurers | 823.5 | 850.4 | 3.3 |
|---|
| Non-Life Insurers | 303.3 | 317.6 | 4.7 |
|---|
| Total | 1,126.8 | 1,168.1 | 3.7 |
|---|
| Shareholders’ Equity | Life Insurers | 82.1 | 76.0 | -7.4 |
|---|
| Non-Life Insurers | 60.1 | 56.5 | -6.1 |
|---|
| Total | 142.2 | 132.5 | -6.9 |
|---|
(Source: Financial Supervisory Service, May 27, 2025)
In summary, insurers’ net income in the first quarter of 2025 declined year on year, as underwriting results worsened due to higher loss-related expenses and rising loss ratios, despite an increase in investment income. Shareholders’ equity decreased as insurance liabilities grew due to falling interest rates and the realignment of discount rates to more realistic levels.
Going forward, as uncertainty in financial markets is expected to increase with regard to equity prices, interest rates, and exchange rates, insurers need to closely manage their financial soundness. The supervisory authority announced that it will closely monitor insurers’ earnings and financial soundness and take preemptive action against potential risks.
Korean Insurance Market
K-ICS Ratios of the Korean Insurance Industry as of the First Quarter of 2025
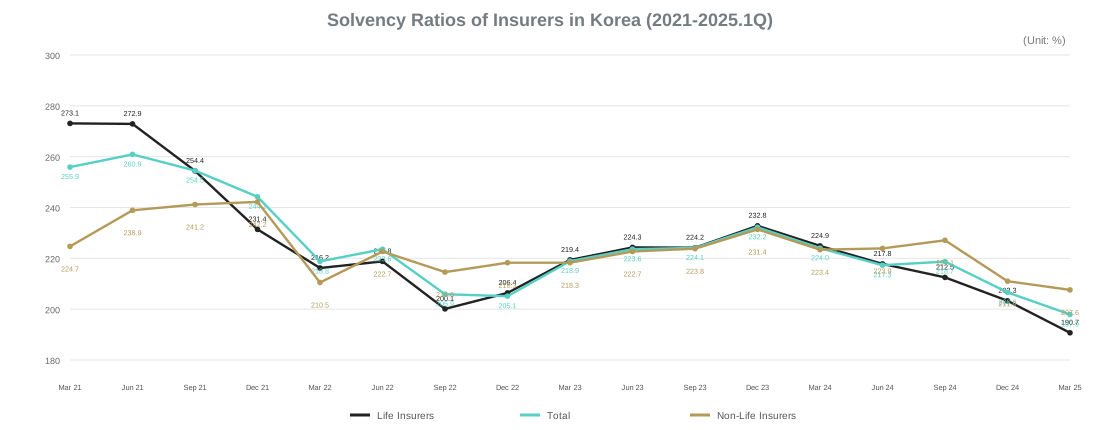
By the end of March 2025, after applying transitional measures, the K-ICS ratio for all insurers in Korea was 197.9%, down 8.7%p from 206.7% in the previous quarter. By sector, the ratio for life insurers was 190.7%, down 12.7%p, while non-life insurers recorded 207.6%, down 3.4%p.
* The 2025 ratios refer to K-ICS ratios after the application of transitional measures.
The main driver of the decline in the risk-based capital ratio was that the increase in required capital (+KRW 5.9 trillion) outweighed the increase in available capital (+KRW 1.3 trillion).
As of end-March 2025, available capital under the K-ICS framework, after the application of transitional measures, stood at KRW 249.3 trillion, up KRW 1.3 trillion from the previous quarter. This was because, despite falling interest rates and the realignment of discount rates to more realistic levels, available capital increased slightly due to the recognition of net income and the issuance of new capital securities, among other factors.
[1] Change in Ultimate Observation Period (20 years to 23 years) and Long-term Forward Rate (4.55% to 4.30%).
As of end-March 2025, required capital under the K-ICS framework, after the application of transitional measures, amounted to KRW 126.0 trillion, an increase of KRW 5.9 trillion from the end of the previous quarter. This was due to a KRW 3.0 trillion increase in disability and disease risk from greater sales of long-term protection-type insurance, and a KRW 1.7 trillion increase in interest rate risk from a widening asset-liability management (ALM) mismatch, among other factors.
< K-ICS Ratios and Impacts from Transitional Measures (as of Late March 2025) >
| Classification | Q4 2024
Before | Q1 2025
Before | Change | Q4 2024
After | Q1 2025
After | Change |
|---|
Available Capital
(KRW trillion) | 245.2 | 245.6 | +0.5 | 248.1 | 249.3 | +1.3 |
|---|
Required Capital
(KRW trillion) | 128.2 | 133.4 | +5.2 | 120.0 | 126.0 | +5.9 |
|---|
K-ICS Ratio
(%, %p) | 191.3 | 184.2 | -7.1 | 206.7 | 197.9 | -8.7 |
|---|
(Source: Financial Supervisory Service, Insurance Companies’ Capital Adequacy Ratios under K-ICS, March 2025, Press Release dated June 18, 2025)
Given the recent base rate cuts and the outlook for a continued low-interest rate environment, insurers will need to maintain efforts to manage asset-liability management (ALM) in preparation for potential further declines in interest rates. This will require not only extending asset duration but also shortening the duration of liabilities. Accordingly, the supervisory authority announced plans to strictly supervise insurers, particularly those with insufficient ALM practices, in order to strengthen risk management.
Korean Insurance Market
The Role of Insurance in Future Korean Society
This report summarizes the key findings of the CEO Report, “The Role of Insurance in Future Korean Society,” published by the Korea Insurance Research Institute in July 2025.
1. Background: The New Administration’s Vision and the Strategic Role of Insurance
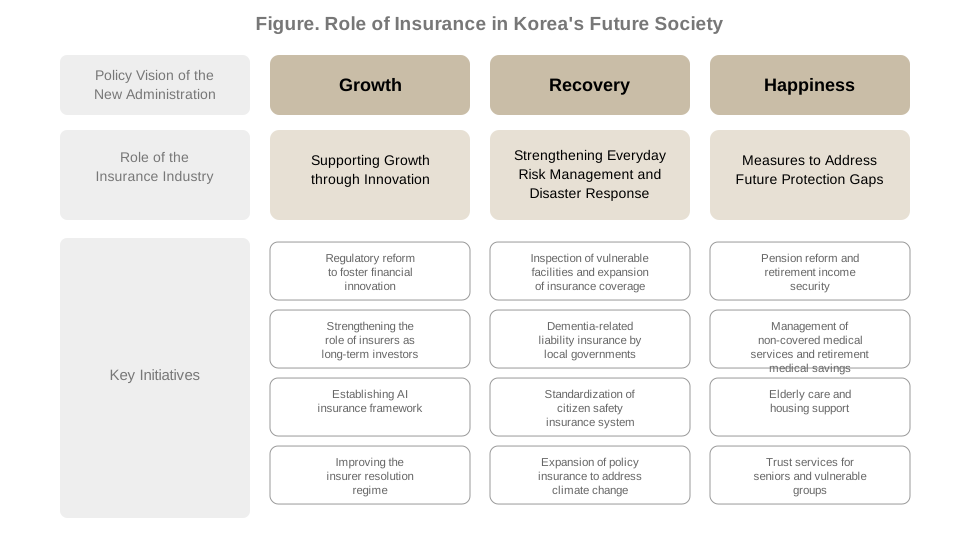
The new administration, inaugurated in June 2025, has adopted “Recovery, Growth, and Happiness” as its three major visions, with plans to intensively foster future strategic industries including artificial intelligence, bio healthcare, content and culture, defense and aerospace, and energy. However, given the limitations of relying solely on government finances, investment participation from the private sector will be essential.
The insurance industry, with its dual functions of risk protection and capital provision, can serve as an institutional foundation for sustainable growth and the development of strategic industries. In particular, high risk industries and long investment horizons will require insurers to provide stable funding and effective risk management.
2. Policy Recommendations: Strengthening the Role of the Insurance Industry
(1) Supporting Growth through Innovation
- Regulatory Reform to Foster Financial Innovation
The current rigid financial regulatory framework constrains autonomous, private sector-led innovation. A principles-based and flexible regulatory system suited to the digital financial environment can balance consumer protection and financial innovation. - Enhancing the Role of Insurers as Long-Term Institutional Investors
Strengthening insurers’ long-term investment role can provide stable funding to strategic industries and improve the effectiveness of private capital participation. - Establishing an AI Insurance Framework
The rapid spread of AI technologies has heightened emerging risks such as malfunctions, hacking and bias. A proactive insurance system is needed to compensate for damages arising from physical AI, robots and autonomous systems. - Improving the Insurer Resolution Regime
A broader range of practical resolution options should be developed to address insolvency, protect policyholders and prevent moral hazard while ensuring market stability.
(2) Strengthening Everyday Risk Management and Disaster Response
- Inspection of Vulnerable Facilities and Expansion of Insurance Coverage
Blind spots in mandatory disaster liability insurance should be reduced through enhanced inspections, expanded enrollment and group liability coverage for vulnerable facilities. - Introduction of Dementia-Related Liability Insurance by Local Governments
Local governments should consider liability insurance to cover third-party damages caused by dementia patients and reduce the financial burden on families. - Standardization of the Citizen Safety Insurance System
Basic covered risks and coverage levels should be standardized to improve regional equity and strengthen the public safety net. - Expansion of Policy Insurance for Climate Crisis Response
Policy insurance should be broadened beyond primary industries to climate-vulnerable populations as the frequency and scale of natural disasters increase.
(3) Measures to Address Future Protection Gaps
- Pension Reform and Strengthening of Retirement Income Security
Measures are needed to strengthen public pension sustainability, close coverage gaps, improve retirement pension payouts and expand private pensions. - Strengthening the Management of Non-Covered Medical Services
Price and effectiveness disclosure and stronger evaluation mechanisms are needed to address overuse of non-covered medical services. - Introduction of Retirement Medical Savings Accounts
A pre-retirement medical savings account with tax incentives should help older adults prepare for future healthcare expenses. - Expansion of Elderly Care and Housing Support
Legal and regulatory frameworks should encourage private participation in care facilities and service-led housing for middle-income seniors. - Promoting Trust Services for Seniors and Vulnerable Groups
Insurance claim trusts, welfare trusts and related legal frameworks should be advanced to protect assets and rights of people with cognitive vulnerabilities.
Korean Insurance Market
2024 Insurance Consumer Behavior Survey : Digital Financial Services and Personal Data
Digital financial services provide substantial benefits to consumers by offering greater speed and convenience, while also fostering innovation and competition. However, these advances have also introduced new consumer risks, including cyber vulnerabilities, indiscriminate collection and use of personal data, errors or misuse in AI and big data analytics, and digital exclusion of older consumers.
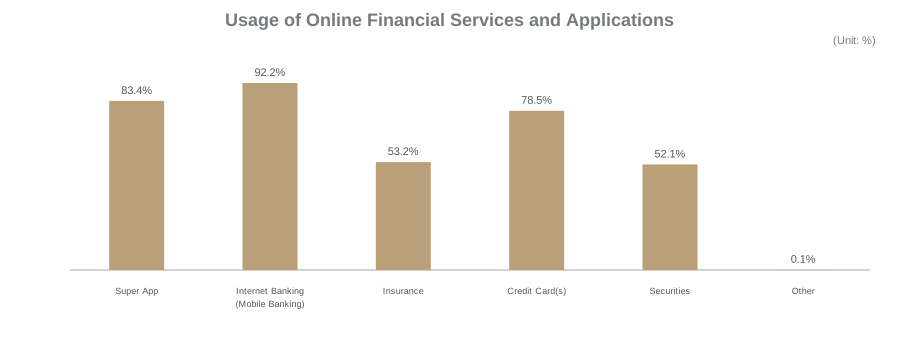
The survey covered 4,000 adults aged 16 to 69. Internet and mobile banking recorded the highest usage rate at 92.2%, followed by super apps at 83.4% and credit cards at 78.5%, while insurance services stood at 53.2% and securities at 52.1%.
Satisfaction Levels for Online Financial Services and Applications(Unit: respondent, 6-point scale)
| Category | Number of Users | Usefulness | Convenience | Design | Reliability | Overall Satisfaction |
|---|
| Super-apps | (3,194) | 4.81 | 4.84 | 4.63 | 4.41 | 4.74 |
|---|
Internet Banking
(Mobile Banking) | (3,532) | 4.78 | 4.65 | 4.48 | 4.57 | 4.68 |
|---|
| Insurance | (2,040) | 4.29 | 4.12 | 4.07 | 4.20 | 4.22 |
|---|
| Credit Cards | (3,008) | 4.59 | 4.49 | 4.40 | 4.44 | 4.53 |
|---|
| Securities | (1,996) | 4.49 | 4.17 | 4.08 | 4.32 | 4.33 |
|---|
(Source: Korea Insurance Research Institute, March 2025)
Satisfaction scores were highest for super apps (4.74), followed by internet and mobile banking (4.68), credit cards (4.53), securities (4.33), and insurance (4.22).
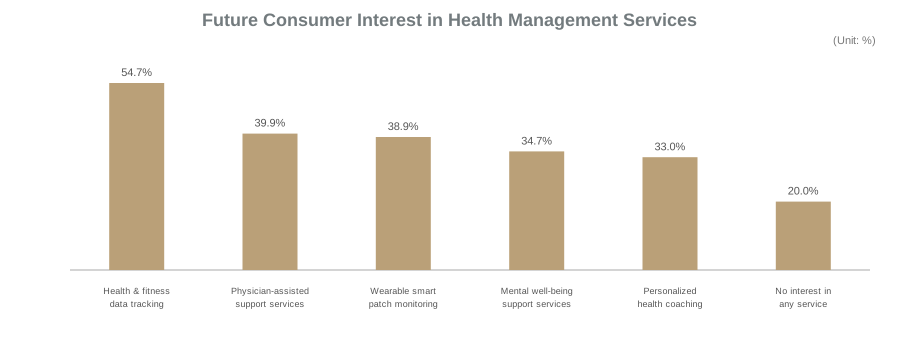
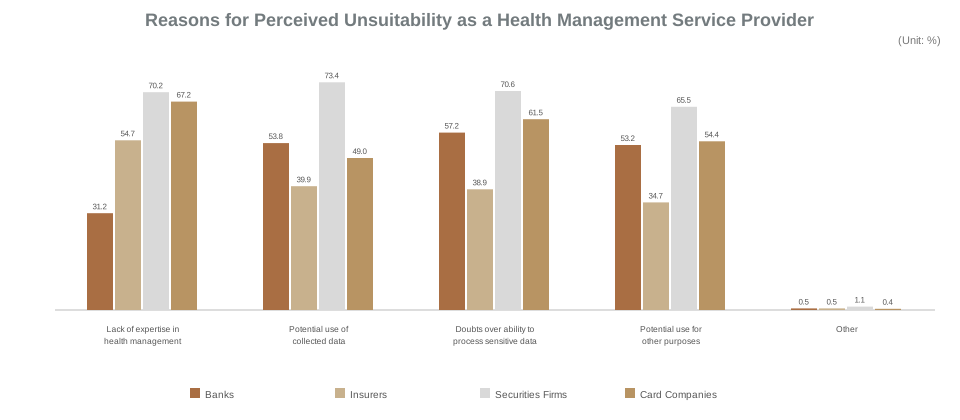
The findings also revealed a negative attitude toward digital health management services provided by insurers, driven by concerns that collected information might be misused and doubts regarding insurers’ capabilities in handling sensitive data.
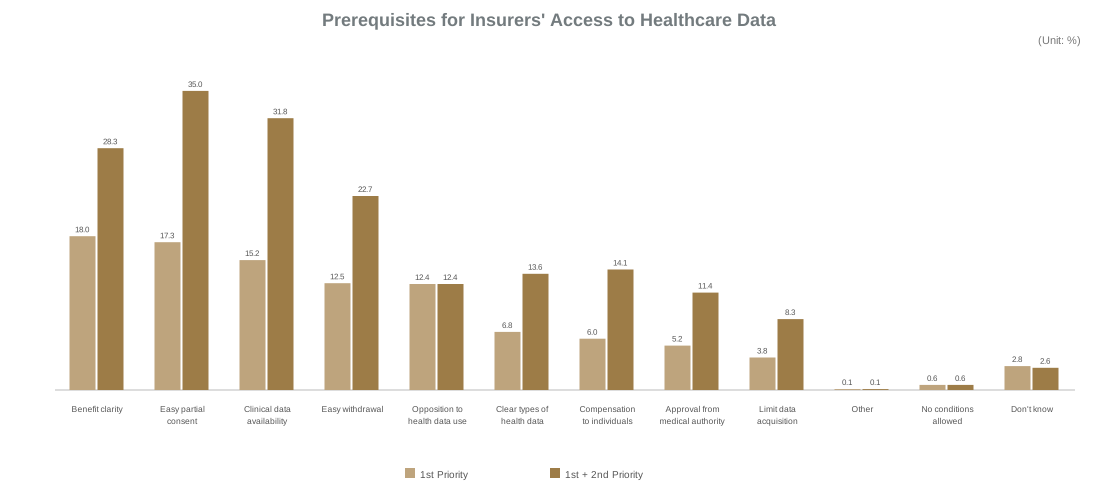
Ultimately, insurers’ credibility is critical not only for driving innovation in core insurance services but also for expanding into adjacent non-insurance domains. Transparency, flexible consent procedures and robust cybersecurity safeguards are essential.
Korean Insurance Market
Korea Ship Insurance Market Overview
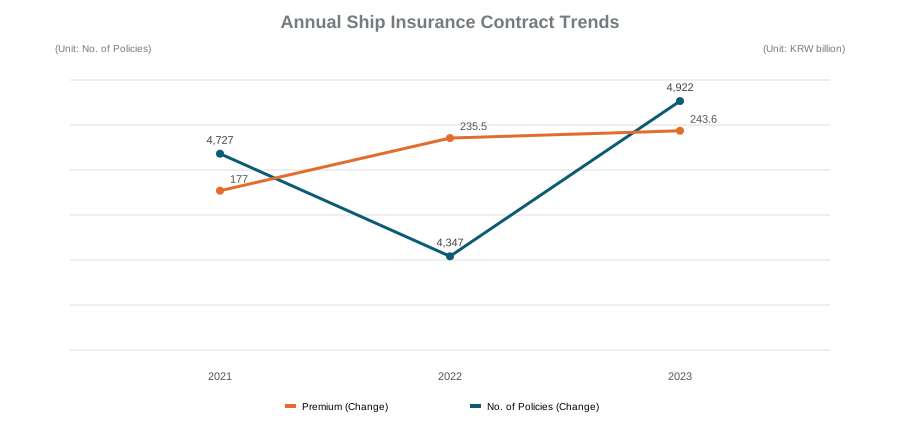
In 2023, ship insurance recorded 4,922 contracts, a 13.2 percent increase from the previous year, while gross written premiums rose 3.5 percent to KRW 243.6 billion. Over the past three years, contract volumes initially declined before recovering, while premium income maintained a steady upward trajectory.
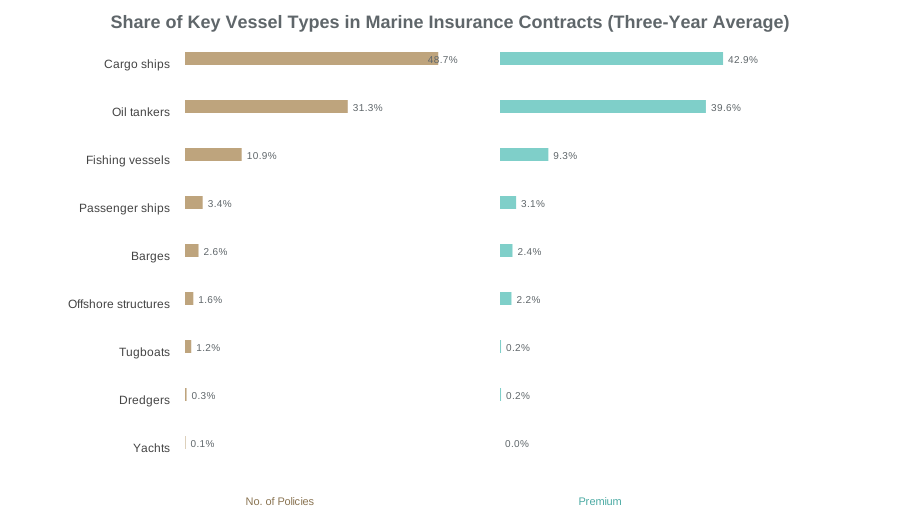
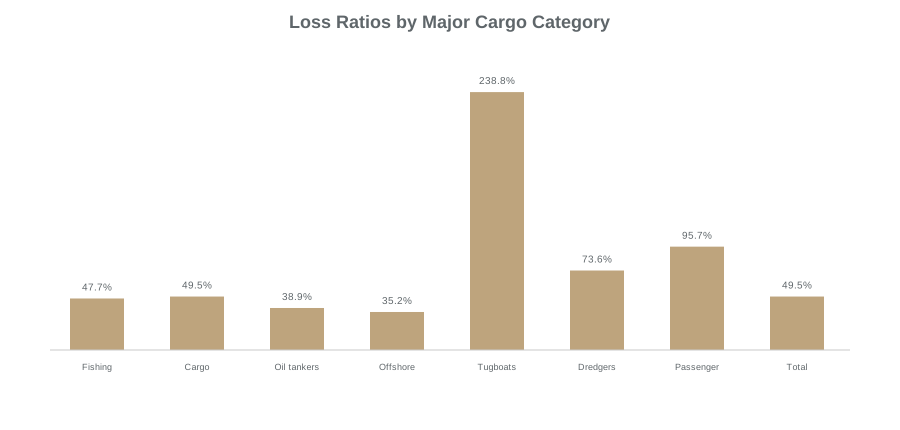
By vessel type, cargo ships and oil tankers accounted for 48.7% and 31.3% of total contracts, and 42.9% and 39.6% of total premiums, respectively. The loss ratio for marine hull insurance averaged 49.5 percent over the past three years, rising from 42.1 percent in 2021 to 49.2 percent in 2022 and 55.1 percent in 2023.
Over the past three years, the loss ratio for marine hull insurance averaged 49.5%, rising from 42.1% in 2021 to 49.2% in 2022 and 55.1% in 2023.
Korean Insurance Market
Analysis of Large-Loss Marine Casualties in Korea over the Past Decade
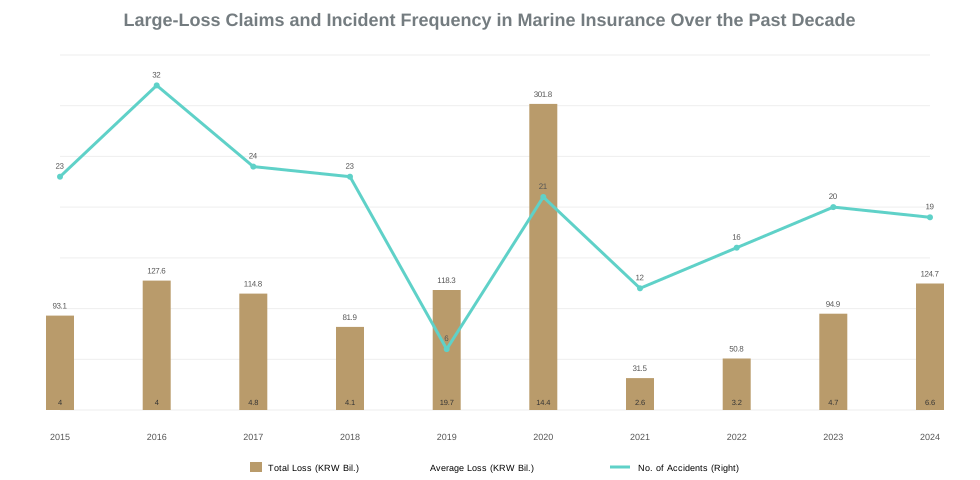
Over the past decade (2015 to 2024), large loss claims in the Korean marine insurance market, defined as individual cases exceeding KRW 1 billion, averaged KRW 113.9 billion per year. Annual losses peaked in 2020 at KRW 301.8 billion and reached their lowest level in 2021 at KRW 31.5 billion. The average loss per case was KRW 5.9 billion.
In total, 193 large-loss incidents occurred, with 2016 registering the highest number at 32 cases and 2019 the fewest at six.
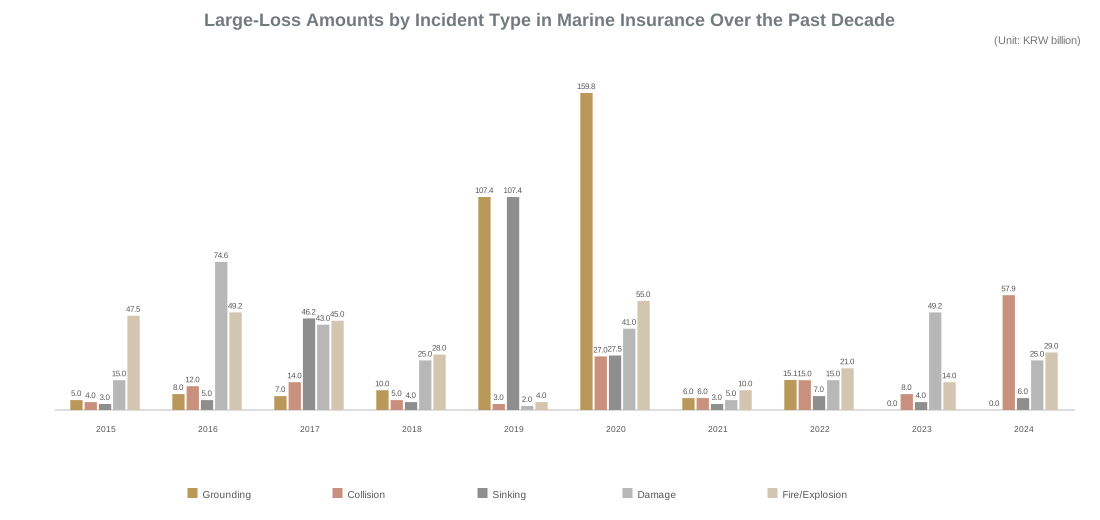
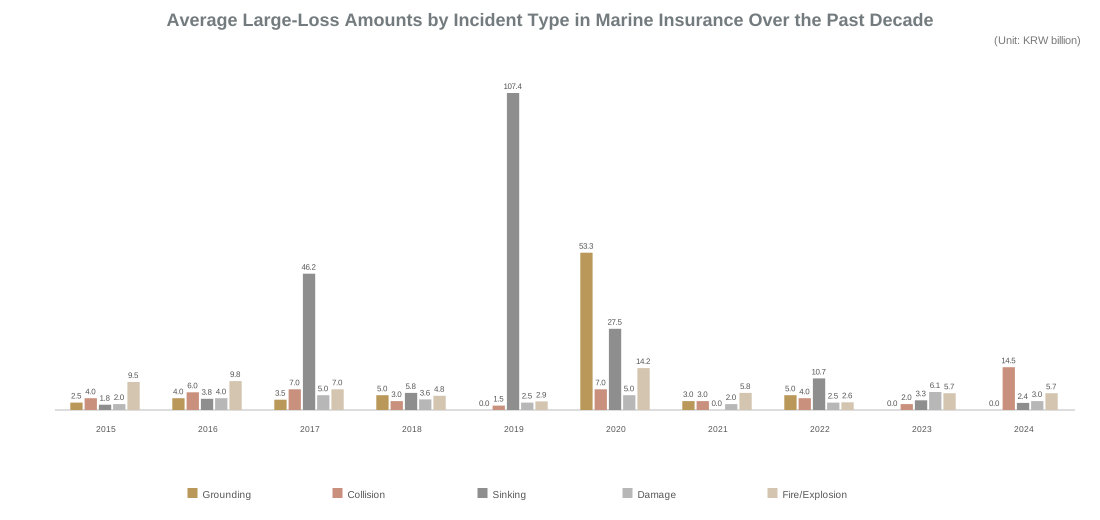
By incident type, damage accounted for the largest share of total losses at 29.2%, followed by fire/explosion (21.2%), sinking (20.7%), grounding (17.4%), and collision (11.5%). In incident frequency, damage accounted for 49.2%, followed by fire/explosion (20.2%), collision (17.1%), sinking (7.3%), and grounding (6.2%). Average loss per incident was highest for sinking at KRW 16.9 billion, followed by grounding at KRW 16.5 billion, fire/explosion at KRW 6.2 billion, collision at KRW 4.0 billion, and damage at KRW 3.5 billion.
Large-Loss Marine Insurance Claims by Type over the Past Decade(Unit: KRW billion)
| Category | Total Loss Amount | Share | No. of Incidents | Share | Average Loss / Incident |
|---|
| Grounding | 197.8 | 17.4% | 12 | 6.2% | 16.5 |
|---|
| Collision | 130.6 | 11.5% | 33 | 17.1% | 4.0 |
|---|
| Sinking | 236.4 | 20.7% | 14 | 7.3% | 16.9 |
|---|
| Damage | 332.5 | 29.2% | 95 | 49.2% | 3.5 |
|---|
| Fire/Explosion | 242.0 | 21.2% | 39 | 20.2% | 6.2 |
|---|
| Total | 1,139.4 | 100% | 193 | 100% | 5.9 |
|---|
Average Large-Loss Amounts by Incident Type in Marine Insurance (10-Year Overview)(Unit: KRW billion)
| Type | Measure | 2015 | 2016 | 2017 | 2018 | 2019 | 2020 | 2021 | 2022 | 2023 | 2024 | 10-Year Avg. |
|---|
| Total | Incidents | 23 | 32 | 24 | 20 | 7 | 21 | 12 | 16 | 20 | 19 | 19.3 |
|---|
| Avg. Loss | 4.0 | 4.0 | 4.8 | 4.1 | 19.7 | 14.4 | 2.6 | 3.2 | 4.7 | 6.6 | 5.9 |
|---|
| Grounding | Avg. Loss | 2.5 | 3.4 | 1.4 | 7.8 | - | 53.3 | 1.3 | 5.0 | - | 7.6 | 16.5 |
|---|
| Collision | Avg. Loss | 1.2 | 6.6 | 9.1 | 1.8 | 1.2 | 5.5 | 2.1 | 1.6 | 1.8 | 14.5 | 4.0 |
|---|
| Sinking | Avg. Loss | 1.8 | 3.8 | 46.2 | 5.8 | 107.4 | 27.5 | - | 10.7 | 3.3 | 2.4 | 16.9 |
|---|
| Damage | Avg. Loss | 2.0 | 4.4 | 5.5 | 3.6 | 2.5 | 5.0 | 2.8 | 2.2 | 6.1 | 3.0 | 3.5 |
|---|
| Fire/Explosion | Avg. Loss | 9.5 | 9.7 | 1.4 | 4.8 | 2.9 | 14.2 | 5.8 | 2.6 | 5.7 | 5.7 | 6.2 |
|---|
An analysis of annual loss amount trends by incident type shows distinct patterns, including a major grounding loss in 2020 and a significant collision spike in 2024. The trend toward larger vessels and higher asset values is raising the likelihood of ultra-large loss incidents, while greater repair complexity is expected to further escalate loss severity.
Notes: RVI (Residual Value Insurance) and LOH (Loss of Hire Insurance) claims are excluded where indicated in the source material.